
Creator of TimingCharts.com
Finally, after being asked a thousand times, systems are now offered as individual downloads.

Futures Truth Top 10 Most Consistent System
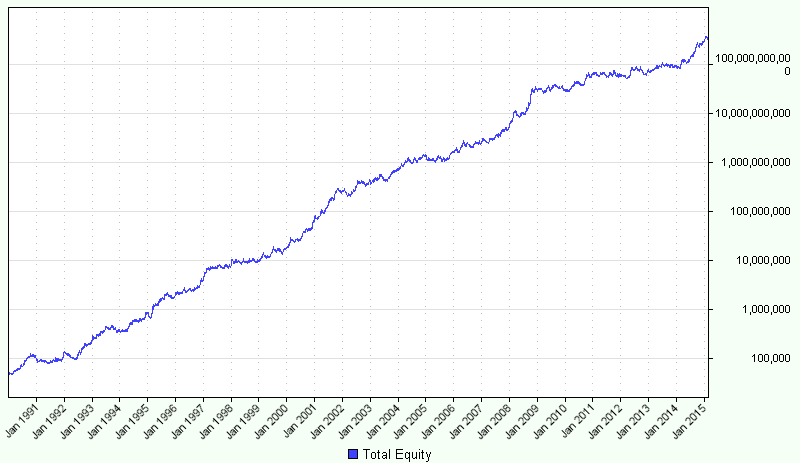
Trend Weaver uses a unique trend filter to determine the direction of the next trade. Trades are only allowed in the direction of the trend.
Once in a position, an exit order trails the position based on the momentum and range of the market.
This gives the trade a reasonable chance to accumulate profits without risking an excessive amount per trade.
The system works on individual markets with varying parameter sets or on a portfolio with shared parameter sets.
AUD/USD, Corn, Crude Oil, Cotton, Euro Bond, UD Dollar Index, EUR/USD, Eurodollar, Feeder Cattle, Gold, Copper, USD/JPY, Lumber, Lean Hogs, Natural Gas, Orange Juice, Palladium, Soybeans, Sugar.
A deduction of $40 per contract traded was used to simulate slippage and commission for each transaction. The same exact rules and parameter sets were applied to each market and throughout the test. This system could certainly be applied to one market at a time with varying parameter sets. Doing so would result in far better results than even shown here.
- Video - Shows exactly how to trade manually
- System Code - TradeStation - Multicharts - Trading Blox - Ninja Trader
- Back-Adjusted Data files - One-time download
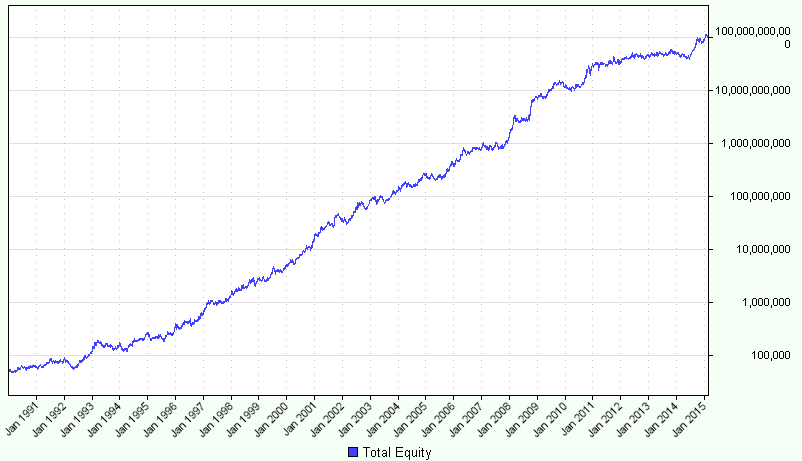
This is a unique system because it takes into account range cycles. Most trending systems are only concerned with the position of price in relation to the recent past.
Hi-Lo Trend only enters new positions when the range cycles indicate the market is ready to go.
Based on the huge edge this system enjoys it’s unlikely too many are using a similar strategy. Particularly interesting are the portfolio results which have produced steady profits for more than 20 years.
AUD/USD, Corn, Crude Oil, Cotton, Euro Bond, UD Dollar Index, EUR/USD, Eurodollar, Feeder Cattle, Gold, Copper, USD/JPY, Lumber, Lean Hogs, Natural Gas, Orange Juice, Palladium, Soybeans, Sugar.
A deduction of $40 per contract traded was used to simulate slippage and commission for each transaction. The same exact rules and parameter sets were applied to each market and throughout the test. This system could certainly be applied to one market at a time with varying parameter sets. Doing so would result in far better results than even shown here.
- Video - Shows exactly how to trade manually
- System Code - TradeStation - Multicharts - Trading Blox - Ninja Trader
- Back-Adjusted Data files - One-time download
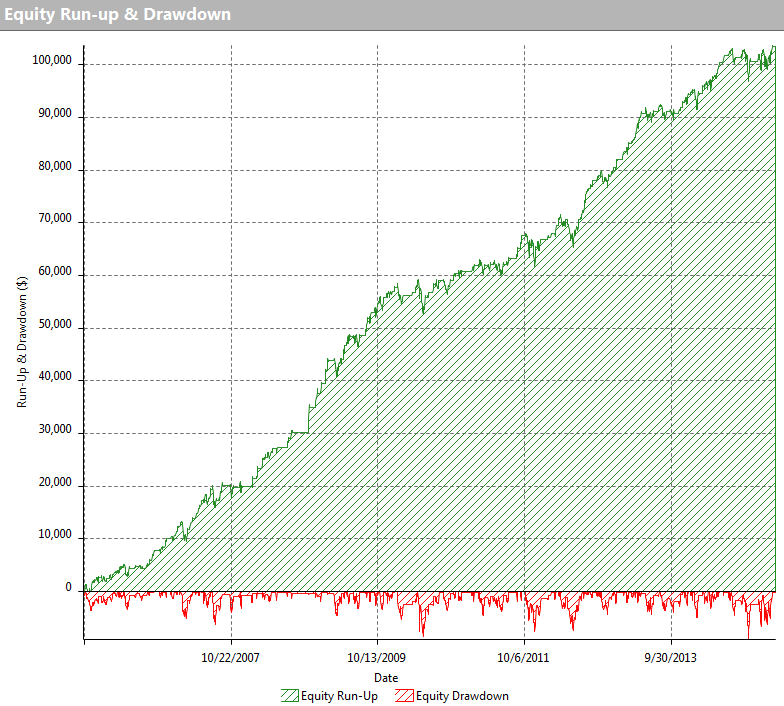
In response to sluggish trend following systems, Swing Machine responds with smart entries and quick exits when the market goes against the trade.
The Swing Machine measures the recent range of the market and enters trades when the range begins to expand.
This approach attempts to keep the system flat during choppy non-directional periods and only enters a new position when the market is on the move.
As you can see from the equity graph, it does a good job of capturing gains while avoiding large losses.
AUD/USD, Corn, Crude Oil, Cotton, Euro Bond, UD Dollar Index, EUR/USD, Eurodollar, Feeder Cattle, Gold, Copper, USD/JPY, Lumber, Lean Hogs, Natural Gas, Orange Juice, Palladium, Soybeans, Sugar.
A deduction of $40 per contract traded was used to simulate slippage and commission for each transaction. The same exact rules and parameter sets were applied to each market and throughout the test. This system could certainly be applied to one market at a time with varying parameter sets. Doing so would result in far better results than even shown here.
- Video - Shows exactly how to trade manually
- System Code - TradeStation - Multicharts - Trading Blox - Ninja Trader
- Back-Adjusted Data files - One-time download
- HD Videos show how to trade each system
- File Downloads for:
- TradeStation - Multicharts - Trading Blox - Ninja Trader
No Mini-Mean files for Ninja Trader - One time download of Back Adjusted Futures Contracts

 1HW1wwjszYXVcDwpEZNif8CbF4a7Dm4jLY
Include your email address and name in Bitcoin memo